CHANGE-READY OR NOT
Climate: our Choice, Our Responsibility
Preparing for the Future:
Change Ready or Not is devoted to understanding and addressing the climate crisis. Read up-to-date insights, analyses, and information to help us preserve the Holocene geological epoch and the environmentally benign conditions which have proven very beneficial for human well-being, and the development of our civilisations.
One component of future power sources is seen in the photograph on the right. It is a Concentrated Solar Power (CSP) plant in Spain. Our Sun has always been, and always will be, the most constant and reliable source of energy for all life on planet Earth
.JPG)

THE FUTURE IS OURS TO DETERMINE
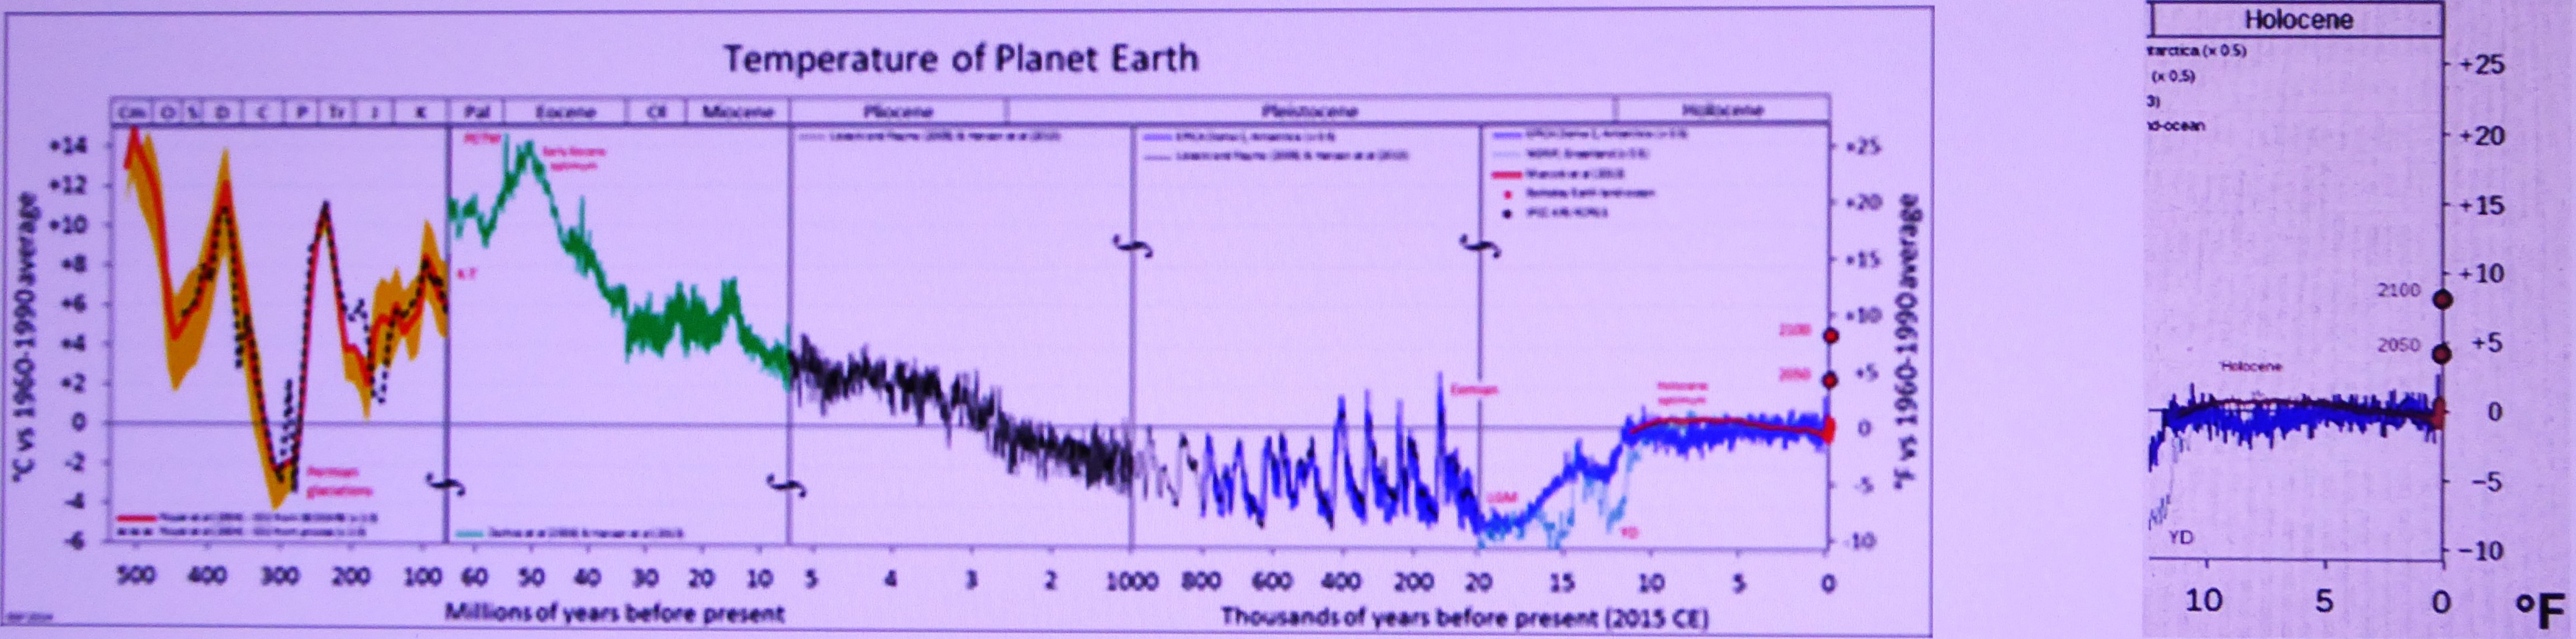
The graph on the right, shows more clearly the Holocene
period. And, more clearly, the +2.11°F (+1.17°C) temperature
compared to the 1960 to 1990 average temperatures.
The Earth's Temperature Is Climbing - again! The above graph, from Wikipedia Commons, shows the current global temperature of +2.11°F (+1.17°C), compared to 1960 to 1990 average. This is the highest since the latter third of the Pleistocene geological epoch about two and a half million years ago.
The Reality of Climate Inaction: Modern humans, and our highly developed structures of civil society, should be wary of testing the higher global temperatures of the first third of the Pleistocene epoch.
Refer to the original Wikipedia Commons file for a larger image.
The Urgency of Change:
It is critically important to reduce carbon dioxide emissions. Time is now of the essence, and very limited, for creating sustainable solutions equitable for all of Earth's people. We need to reduce the occurance and frequency future climate catastrophes. Continued destruction of the environment will lead lead to catastrophic consequences.
happening all over the world:
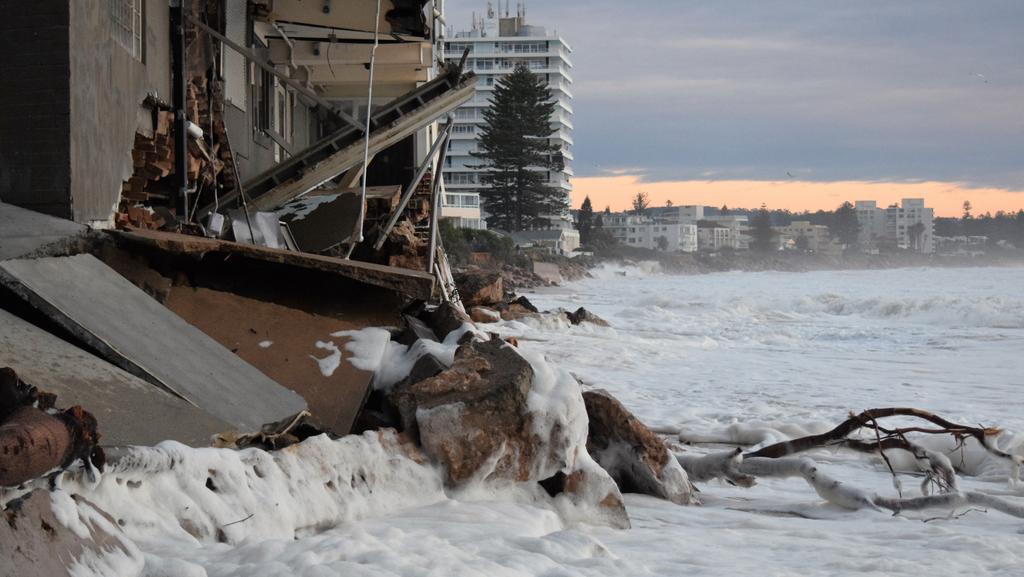
The effects of rising and warmer oceans are being manifested all around the world. The problem is threefold:
A. Ice melt raises sea levels,
B. Thermal expansion, from increasing ocean temperatures, also
raises sea levels
C. Heat absorbed from the atmosphere increases ocean energy
levels and causes more severe storms,
Collaroy Beach Club 2016: Acknowledgement: William West/AFP
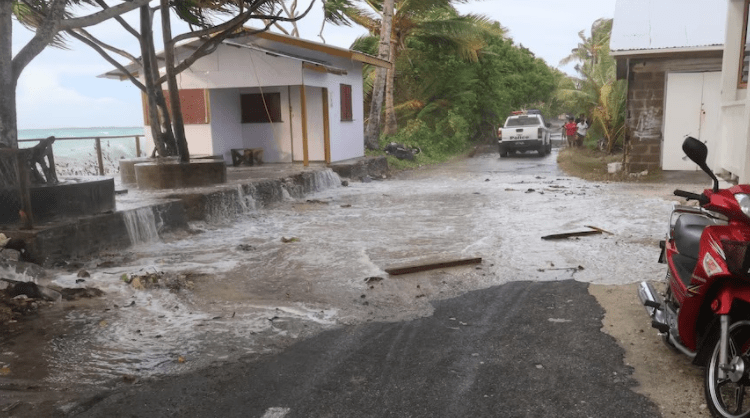
FUNAFUTI, TUVALU
King tides, in April 2024, damaged roads near the coast in Funafuti, Tuvalu.
Weather effects, that have occasionally been very severe and damaging are going to happen with much greater frequency.
Instead of one-in-one-hundred-year weather events, we shall be talking of one-in-ten-year weather events!
Supplied: Tuvalu Meteorological Service
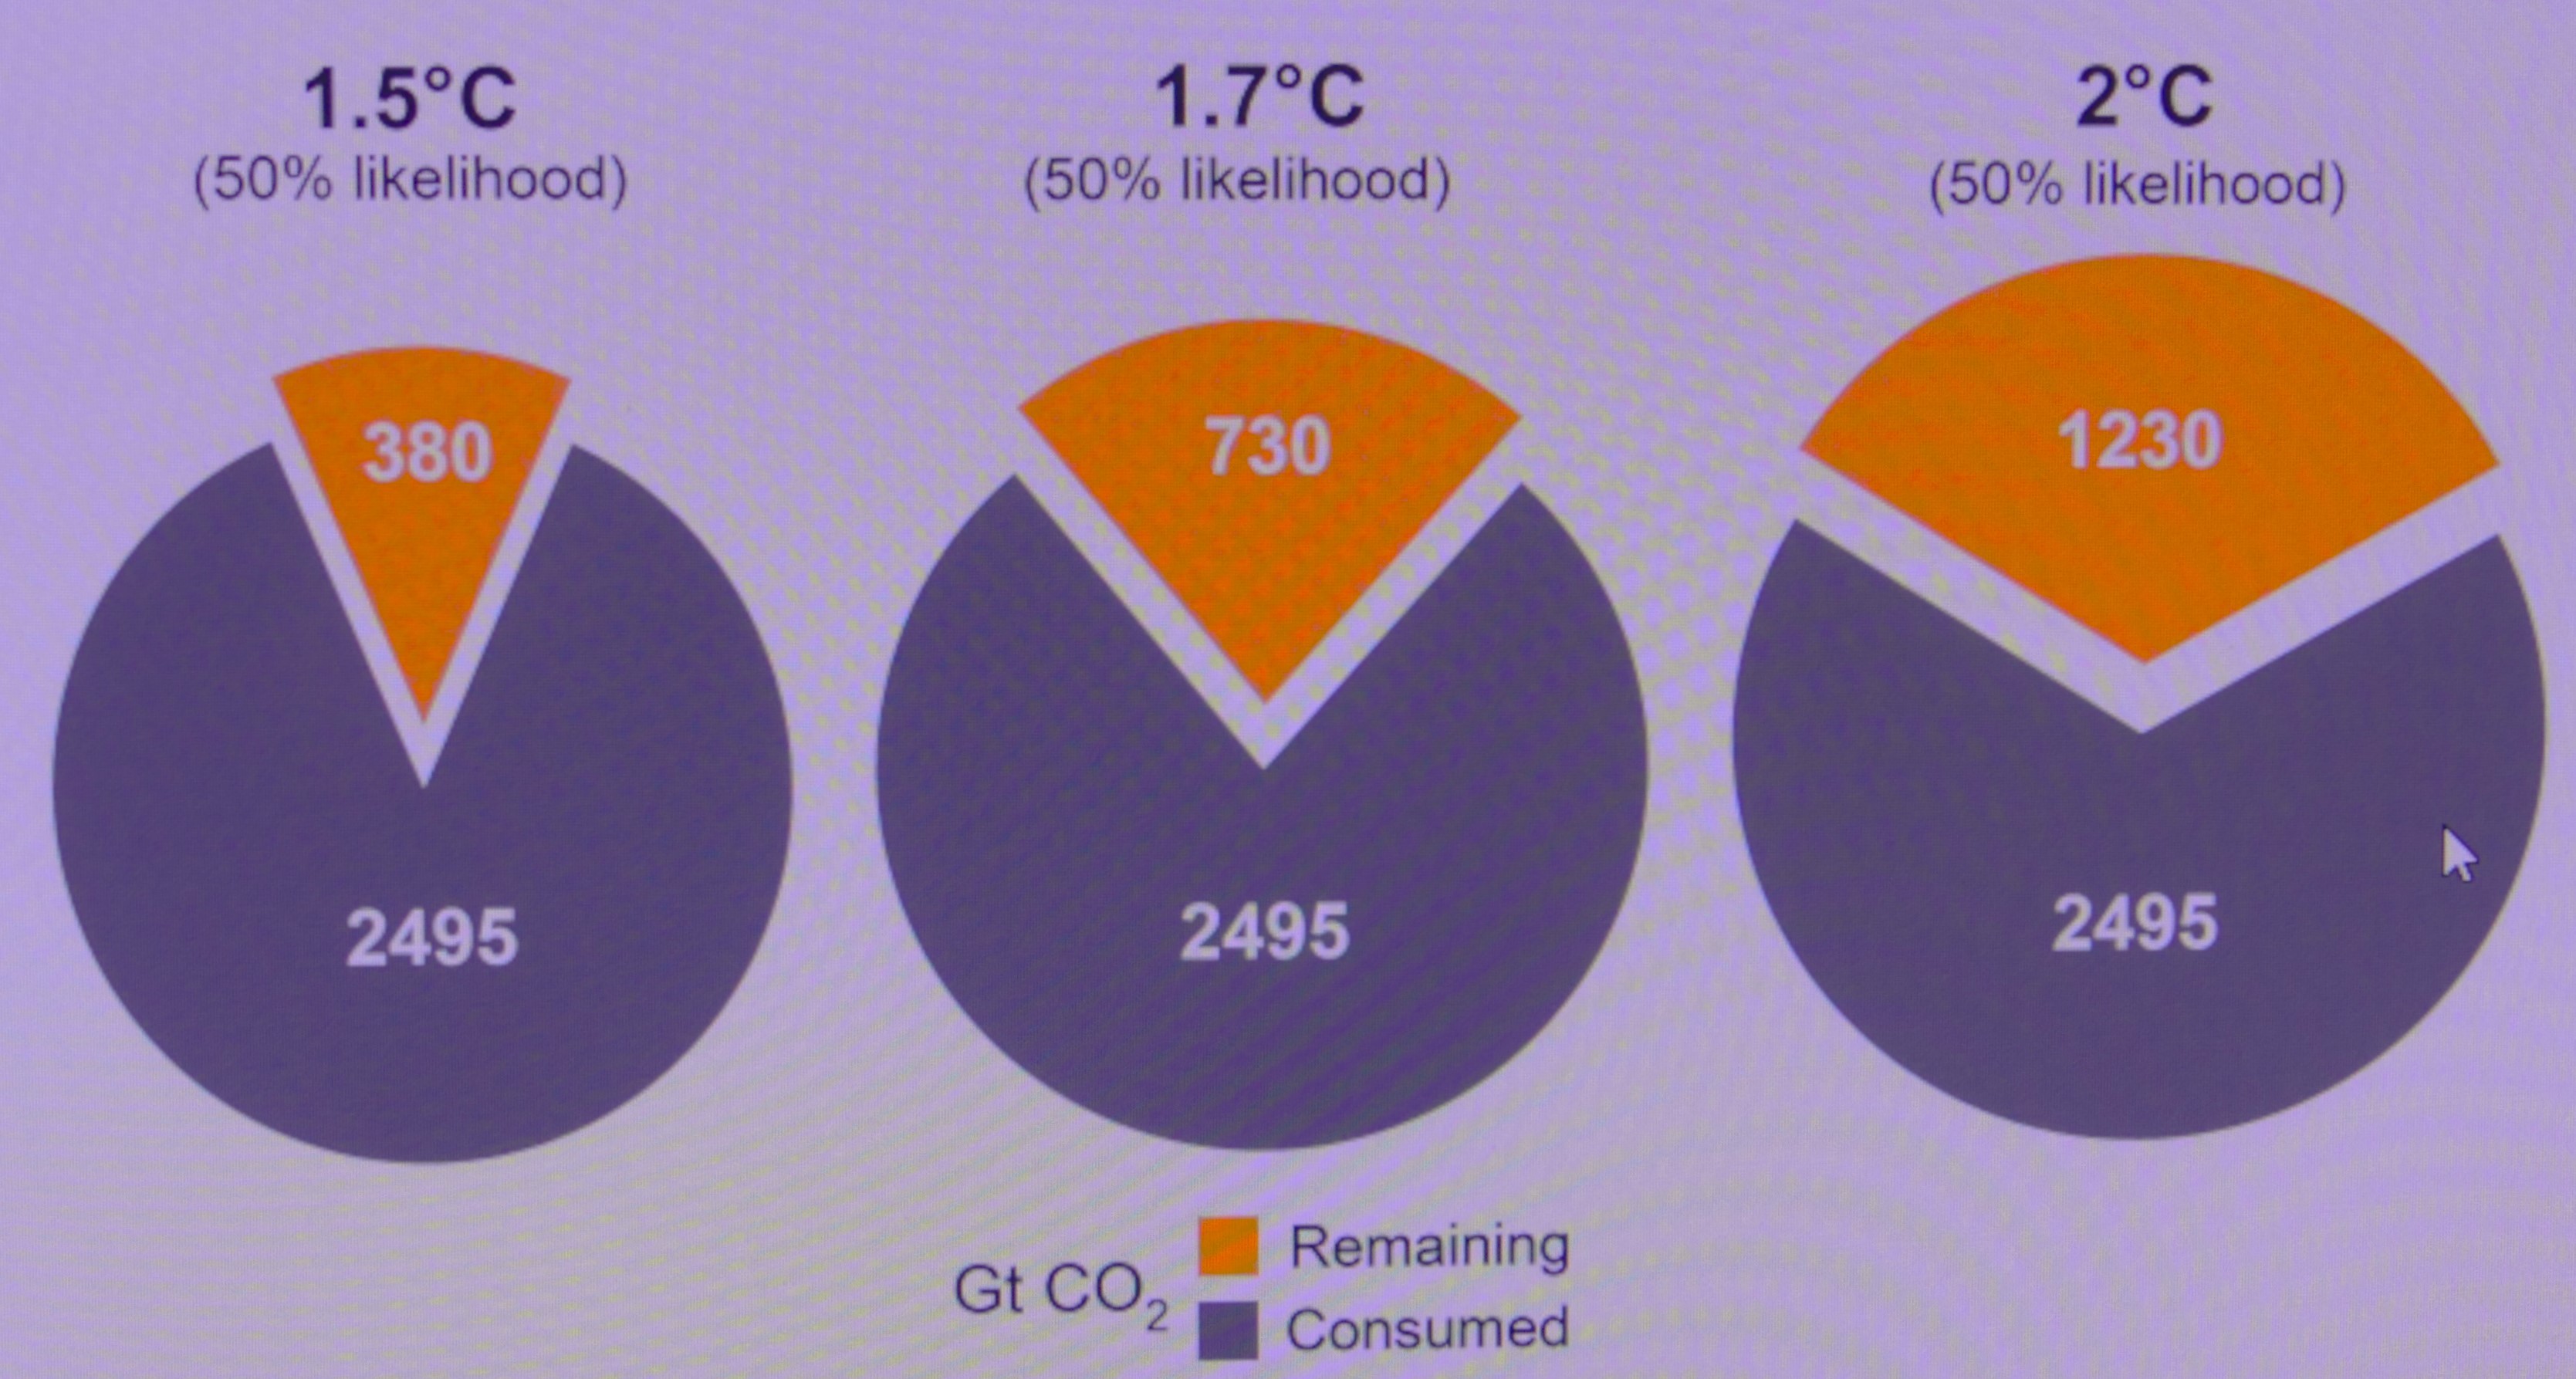
Total CO2 emissions - 1750 to when??
It is critically important to reduce carbon emissions, and time is of the essence. We must find sustainable solutions as there is a maximum amount of carbon that can be emitted into the atmosphere over all of time. The adjacent IPCC diagram shows, in orange, the maximum amount of CO2 the the whole world can emit, going forward, to keep the global temperature below 1.5°C, 1.7°C, and 2°C. The years 2032, 2041, 2053 correspond to the orange sectors as the size increases. It is interesting to note that 2°C Pie Chart of 2495 Gt +1230 Gt = 3725 Gt CO2 and when divided by 3.67 (CO2 to CO ratio) = 1015 Gt CO ≈ 1 trillion tonne carbon.
Source: IPCC AR6 WG1

Regrettably, Fossil fuels Still play a big role!
.png)
Countries that have stated policies regarding the path to net zero known as STEPS. In 2020, the updated Stated Policy Scenario (STEPS) still shows the role of fossil fuels in the total energy supply in 2050 at 60%. Renewable energy sources will even then, still only make up for 40% of the total energy supply.The percentage of renewable energy sources (right hand scale on above graph) is represented above the yellow line. The 60% of total energy supply in 2050, would still see CO2 emissions of over 20 Gt into the atmosphere every year.
This is not even close to being good enough!
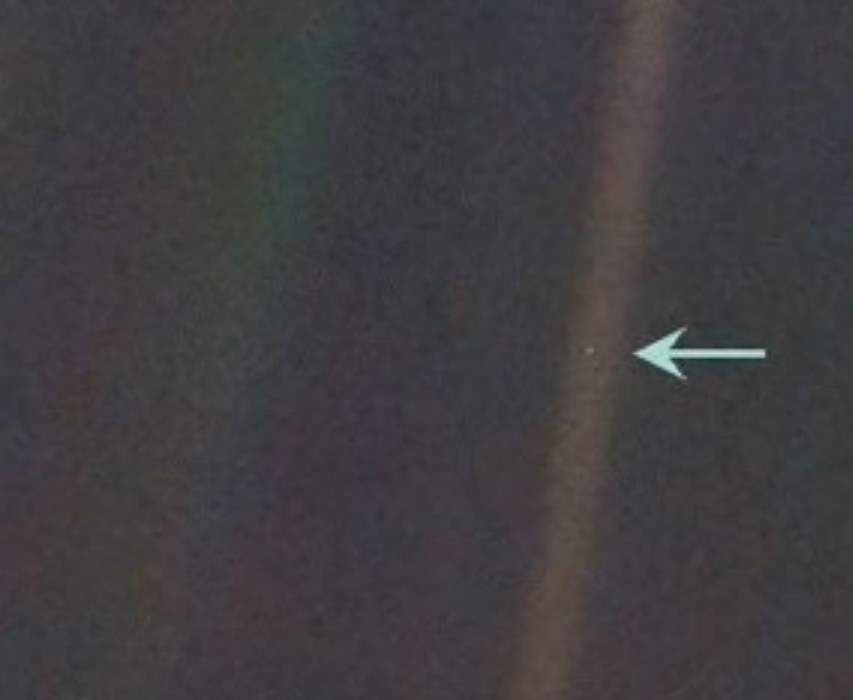
The Earth from 6 billion kilometres into space
“Look again at that dot. That's here. That's home. That's us. On it everyone you love, everyone you know, everyone you ever heard of, every human being who ever was, lived out their lives.
The aggregate of our joy and suffering, thousands of confident religions, ideologies, and economic doctrines, every hunter and forager, every hero and coward, every creator and destroyer of civilization, every king and peasant, every young couple in love, every mother and father, hopeful child, inventor and explorer, every teacher of morals, every corrupt politician, every "superstar," every "supreme leader," every saint and sinner in the history of our species lived there-on a mote of dust suspended in a sunbeam.” Carl Sagan: 1994
There is a heap of exceedingly brilliant, detailed and complex work carried out on Global Warming, Climate Change, or Planetary Heating, by hundreds of different Research Organisations, Government Agencies, Universities and the United Nations. Take your pick!
Global Warming, Climate Change, or Planetary Heating, they are all terms describing the mess we are in on planet Earth. No one source can answer all the questions, and Change Ready or Not is certainly no exception to the rule.
All of the organisations listed below will help to fill in any gaps that will inevitably pop up in any discussion on this topic.
This is not an exhaustive list.
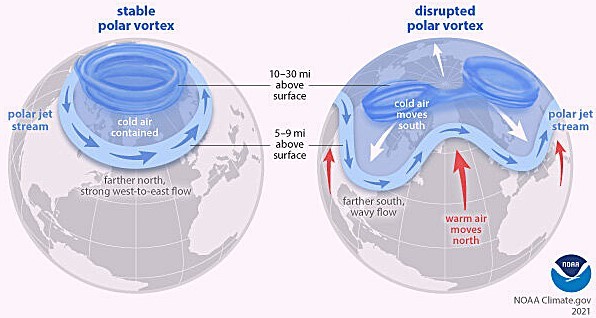
Image credit: National Atmospheric and Oceanic Administration (NOAA)
STABLE POLAR VORTEX & DISRUPTED POLAR VORTEX
The polar vortex is an area of low pressure cold air, over and surrounding, Earth’s North and South Poles. The Polar Vortex is the name given anti-clockwise flow of air that is instrumental in keeping the colder air near the Poles. [See LH diagram above - Stable Polar Vortex].
The Polar Vortex becomes disrupted, as a consequence of the heating of the planet, when warm air pushes north, in the case of the Arctic, from the equatorial regions. The Polar Jet Stream becomes 'wavy', and instead of a concentrated region of low pressure roughly centred on the north pole, multiple regions of low pressure form, and the polar vortex is destabilised. [See RH diagram above - Disrupted Polar Vortex]
This is when extreme, arctic-like, weather conditions are experienced at much lower latitudes than previously.
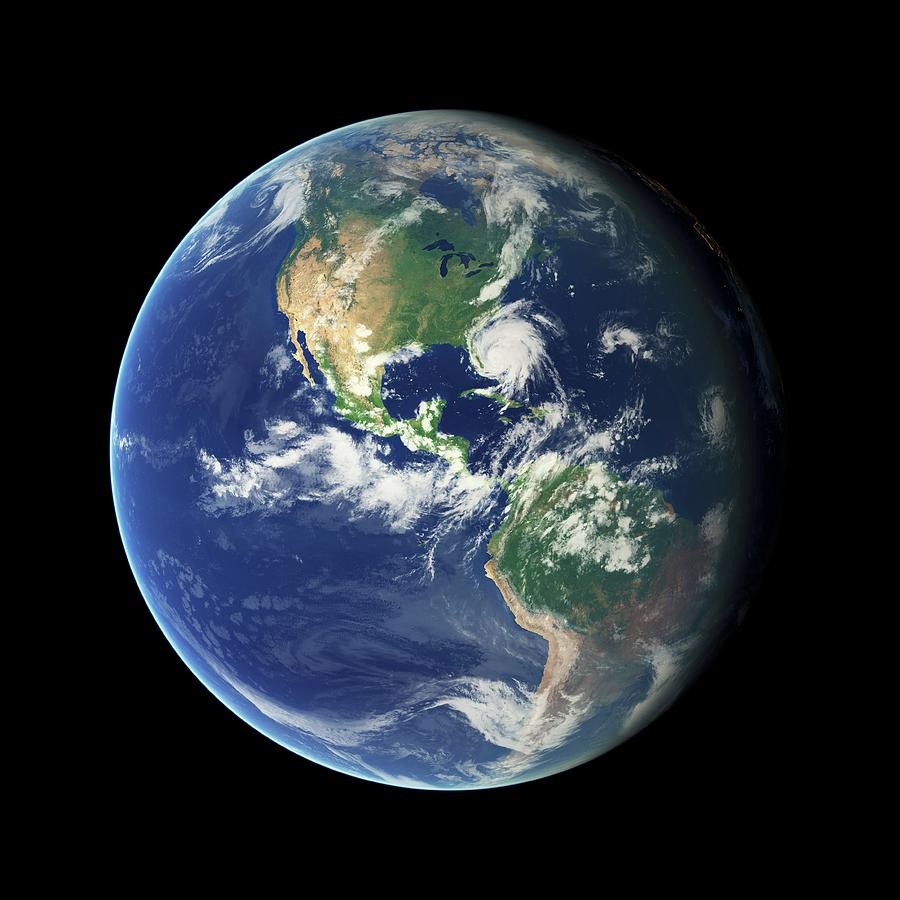
.jpg)
Image credit National Atmospheric and Oceanic Administration (NOAA)
An illustration of a single region of low atmospheric pressure, but with the polar vortex and polar jet stream, beginning to to destabilise. [LH]. The RH illustration shows multiple regions of low pressue, disrupted polar vortices and polar jet stream.
.jpg)
In this barametric pressure chart, there appears to be 5 or 6 regions of low pressure/cold air - shown in mauve/purple.
The United Nations Framework Convention on Climate Change (UNFCCC)
The Intergovernmental Panel on Climate Change (IPCC)National Oceanic and Atmospheric Administration (NOAA)International Energy Agency (IEA)National Aeronautics and Space Administration (NASA)Our World in Data
The World Bank Group - Climate Change Knowledge PortalUnited States Environmental Protection Agency.World Resources Institute (WTI)National Weather, Meteorological, Offices and Bureaus
International Energy Agency (IEA)National Geographic
Wikipedia
This is what we are fighting for.
Change Ready or Not (changereadyornot.com) provides analyses and insights about the current climate crisis. Change endeavours to present strategies to re-stabise the chemistry of the biosphere without causing the planet to sink into wars and injustice.
To pretend this can be achieved without substantial financial investment is a fantasy of the highest order. It is also a fantasy to believe funding can be attributed to the nation states that have not benefited substantially from using the biosphere as a zero cost carbon sink.
The alternative to properly funding the fight, will be chaos and catastrophe.

Wind turbines will not destroy our way of life. if we ignore the heating of the planet, the way of life many enjoy, or aspire to, will certainly be at risk.
Wind turbines in the Baltic Sea between Denmark and Sweden. We can learn to live with the new technology, just as we learned to live with the pollution from coal fired electricity generation.
Pollution from the burning of all fossil fuels has been harmful for human health for a couple of centuries.
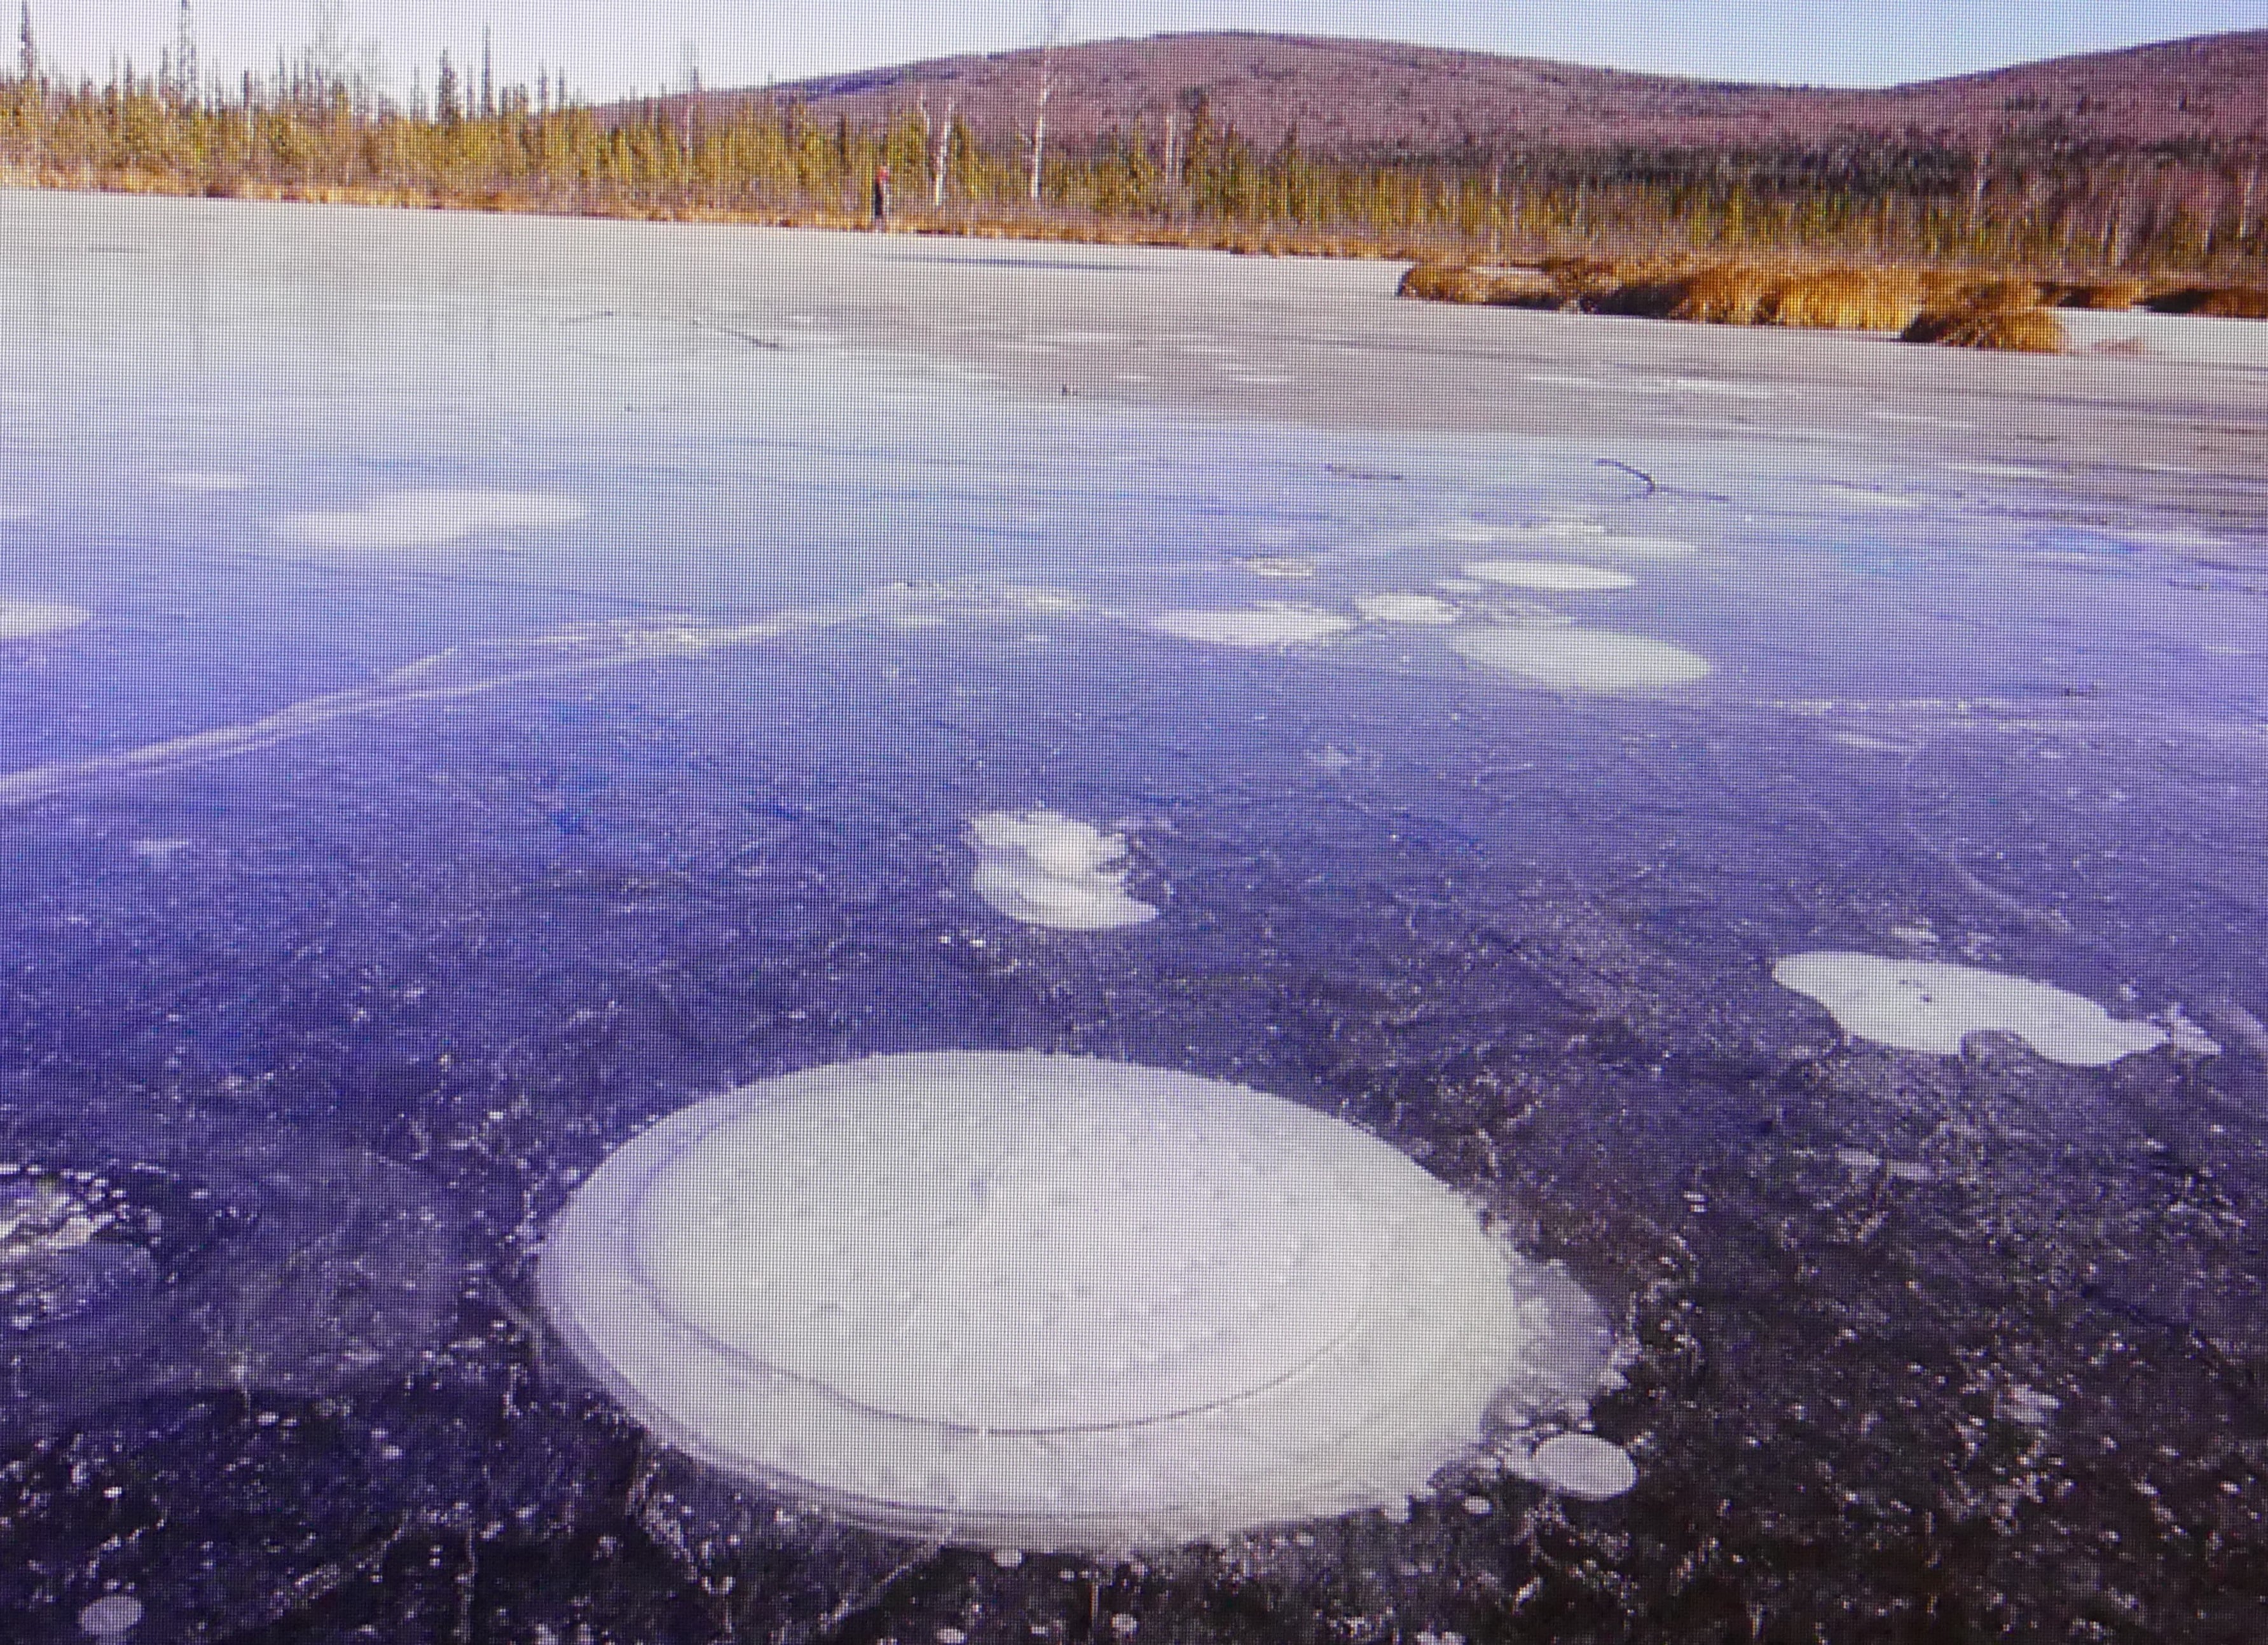
Katey Walter Anthony/ University of Alaska Fairbanks.
serious feedback caused by melting permafrost in the tundra regions.
As the planet heats, methane trapped under the frozen Tundra is allowed to escape into the atmosphere. Shorter lived in the atmosphere, but 25 to 30 times a more potent Greenhouse Gas (GHG) than Carbon Dioxide (CO2), its escape is dangerous.
Especially, as the addition of Methane, puts even more GHG into the atmosphere, which adds to planetary heating, which, in turn, causes more Methane to be released.
A very dangerous feedback loop if ever there was one!
The photograph on the left shows, methane bubblling up through the surface ice of of a thermokarst lake, from the thawed permafrost at the bottom of the lake.
Above all, be aware, over the past four decades, the Arctic has warmed almost four times faster than the global average.
.jpg)
Source: Hadley Centre and Climate Research Unit (CRU)
Temperature: 1850 to 2020
The 1850 to 1900 0°C Holocene baseline persisted for 11,600 years. Then a huge spurt in global heating 1900 to 1950. The temperature stabilisation ≈1950 to ≈1970 was due to the, post WWII massive industrial expansion, fuelled by extremely polluting electricity generating, and industrial practises, which produced large amounts of 'sun-shielding' sulphur dioxide (SO2) and fine particulate matter. Post the 70's is easy to see.
.png)
Source: IPCC
Solving the problem of a rapidly warming earth, will require the very highest level of political & economic leadership .
There is currently much discussion in Australia about the best low emission generation of electricity, but very little about the OTHER 75% of emissions.The ONLY way to properly address net-zero is by an all-encompassing price to emit GHG's into the biosphere.
.JPG)
Acknowledgement: Claus Andersen, CLIMATE POSITIONS, Denmark.
land, ocean & Land/ocean:
average temperatures. 1880 to 2016
The blue line on the graph is Land temperature. The red line is Ocean temperature, and the yellow line is Land/Ocean temperature. Research by Claus shows land temperature rise precedes ocean temperature by about twenty years, and the combined rise by about 15 years.
.jpeg)
Source: UK Met Office
50% increase in CO2
The pre-industrial concentration of CO2 in the atmosphere was 278 parts per milliion (ppm) of dry atmosphere gases. 417 ppm represented a 50% increase!Increasing an essential trace greenhouse gas (GHG) by 50% is unconscionable, if not completey and utterly crazy. The 'we did not know at the time' cry is no excuse because we've ALL known for over 30 years.
.jpg)
Source: NASA, GISS, NOAA, NCEL, ESRL, Climate Central
Why is it happening
Very little doubt about the close relationship and cause of the heating of the planet. The carbon dioxide (CO2) and rising temperatures (°C) have been pretty much locked step for the whole of the Industrial Age. It is considered by many that 'global warming' is a platitude designed to hide the clear fact that the Earth is heating up! Methane (CH4) pollution is also a massive contributor to temp. rise, and will form a further analysis topic.
.jpg)
Source: Copernicus - ECMWF
Global surface temperature increase above pre-industrial
A closer look at the rapid global temperature increases since the mid-1970's. The time-lag (hysteresis) after the clean-up of 'dirty power' in the 50's and 60's is clearly seen. SO2 and the very fine particulate pollution both acted as 'sun-shields'. Industrial activity post WWII was mainly centered on North America, Europe, East Asia, and the Soviet Union - all in the Northern hemisphere. This northern bias still applies today, which probably explains why the Arctic region is warming four times faster than the global average.
.jpg)
Source: University of Arizona Matthew Osman, Post Doctoral Researcher
Temperature (°C) rise 20,000 YEARS BCE TO NOW
16,000 years BCE saw the last Ice Age beginning to end. The accepted date of 11,700 BCE ended the Ice Age, and saw the start of the Holocene Geological Epoch. The scale of the graph, for the 1000 years until today, has been enlarged to more clearly show the rapid temperature rise since the beginning of the 20th century.